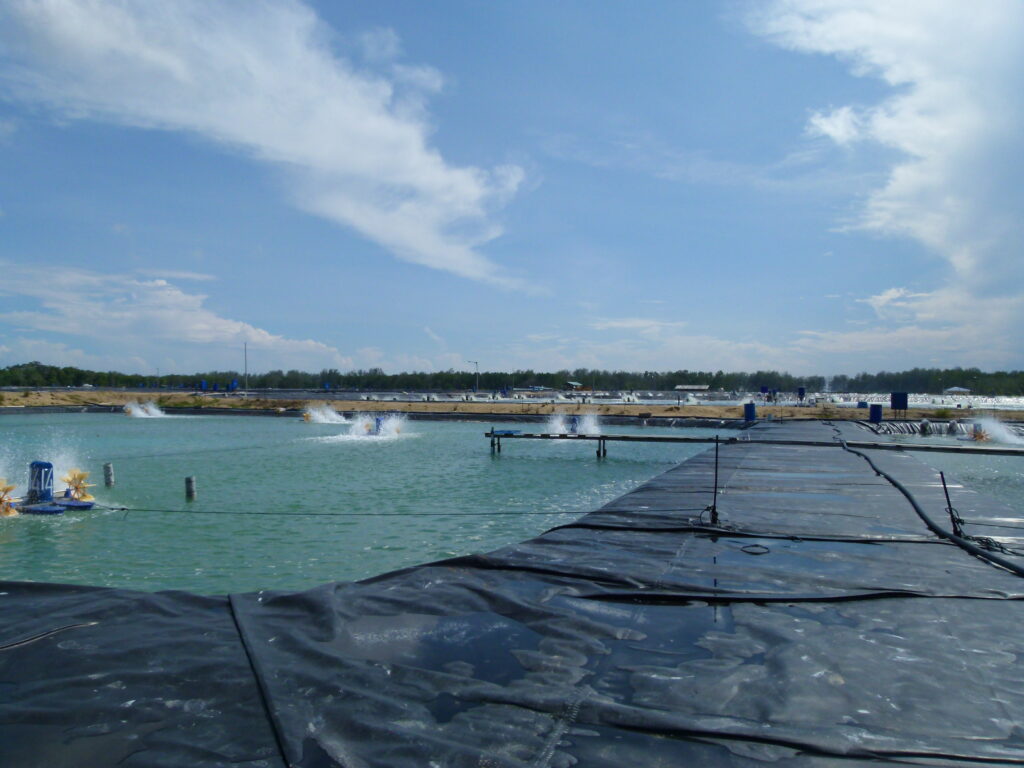
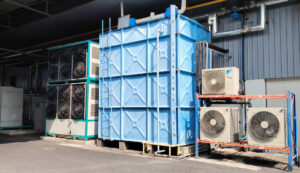
Rainwater Harvesting
As part of our ongoing commitment to water conservation, we continue to harvest rainwater for non-potable use, capturing runoff that
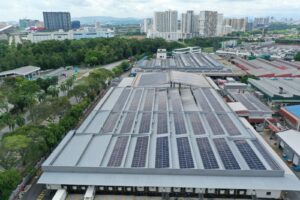
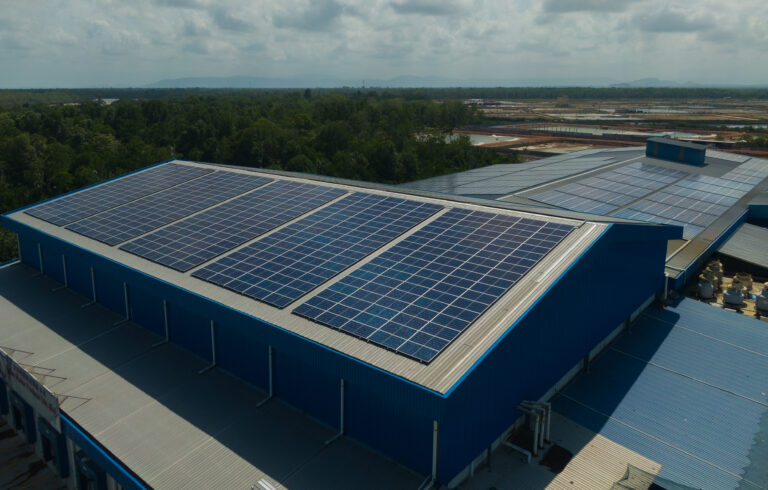
Renewable Energy
To further reduce our GHG emissions and reliance on fossil fuels, we continued to expand our renewable energy portfolio in